Collaborative software & database design
Finally a workspace for teams to visualize requirements, design complex systems, and build the next big thing.
Over 70M+ users love Miro.
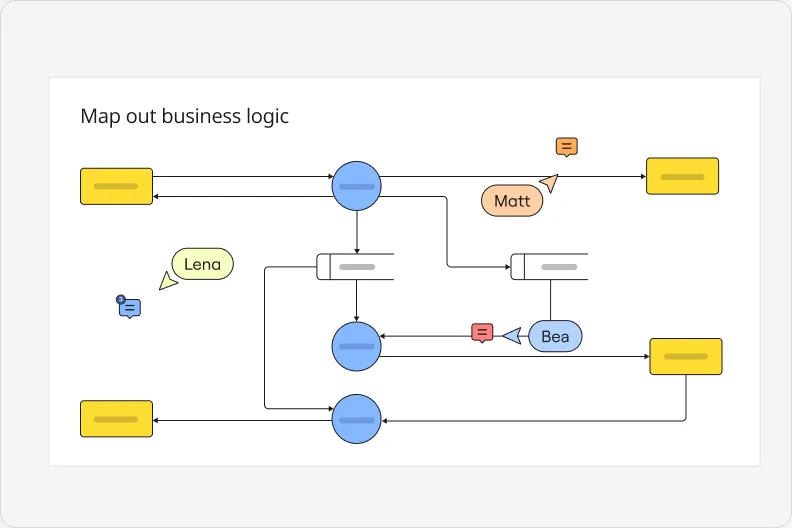
Diagram and visualize software architectures
Access more than 2000 shapes and diagramming templates so your team can go from brainstorming to technical documentation in one place.
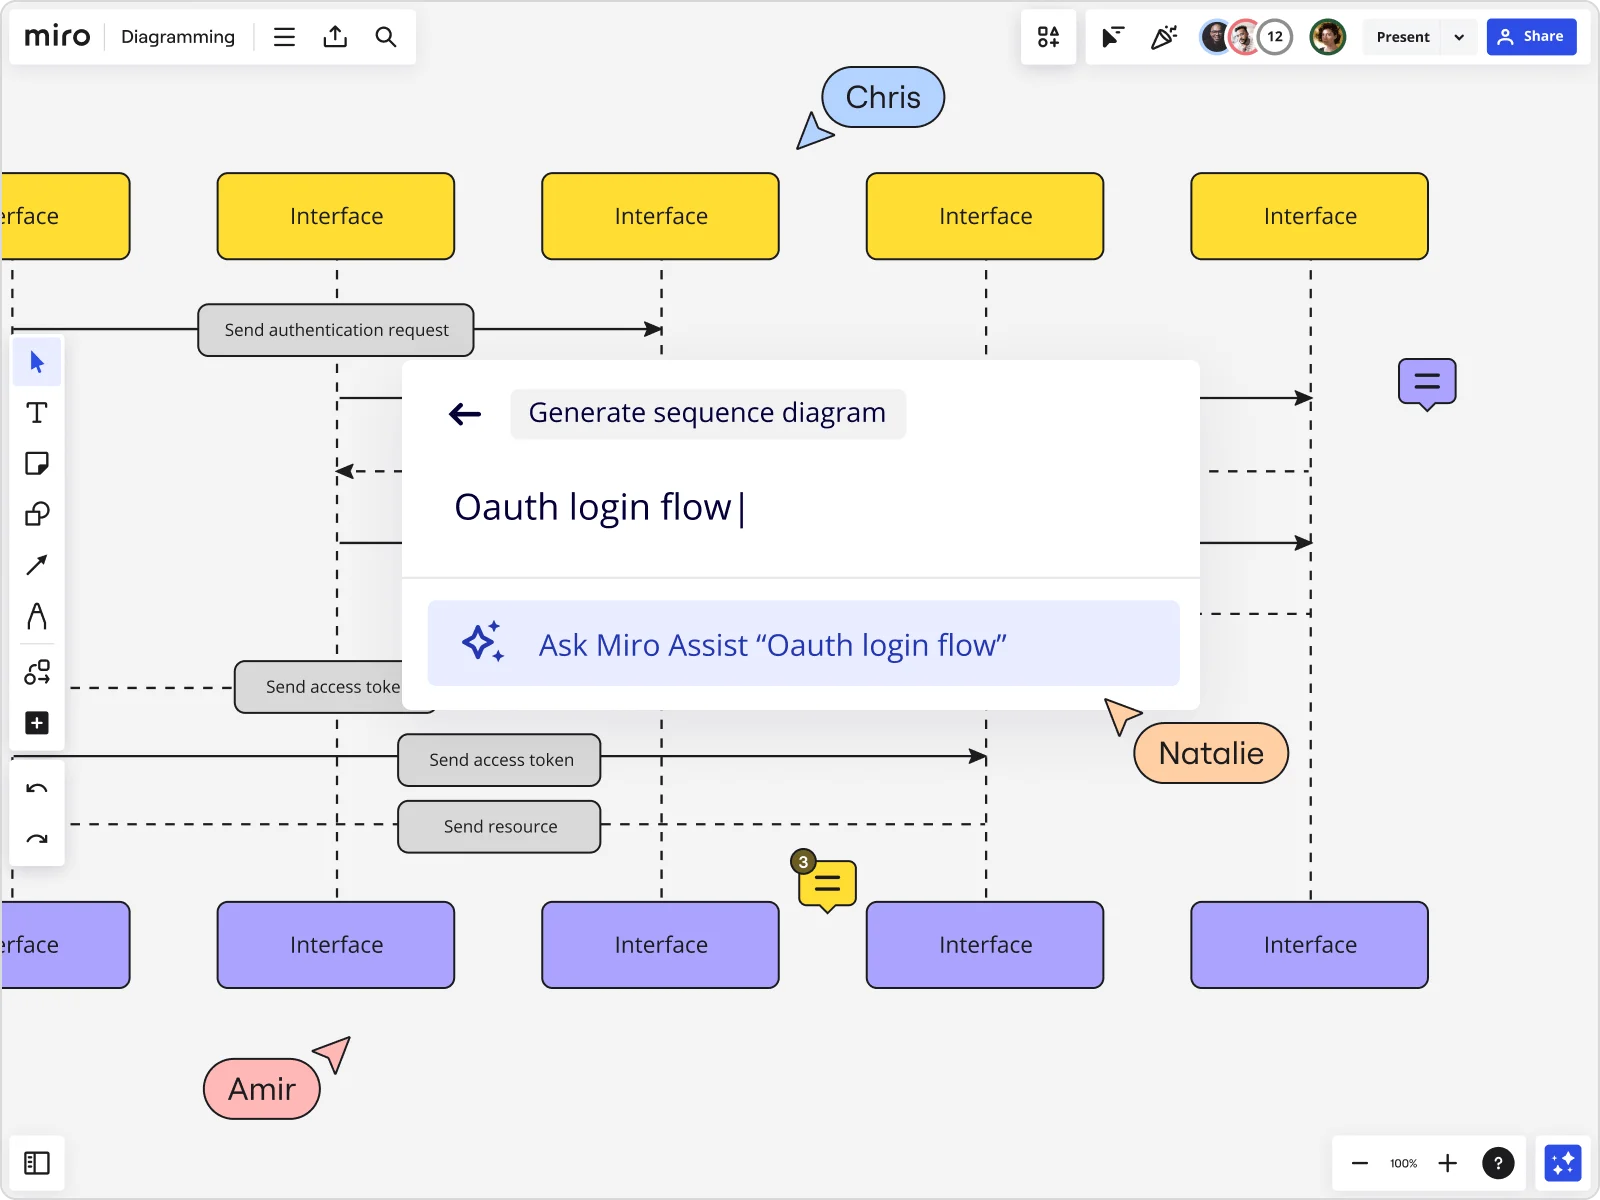
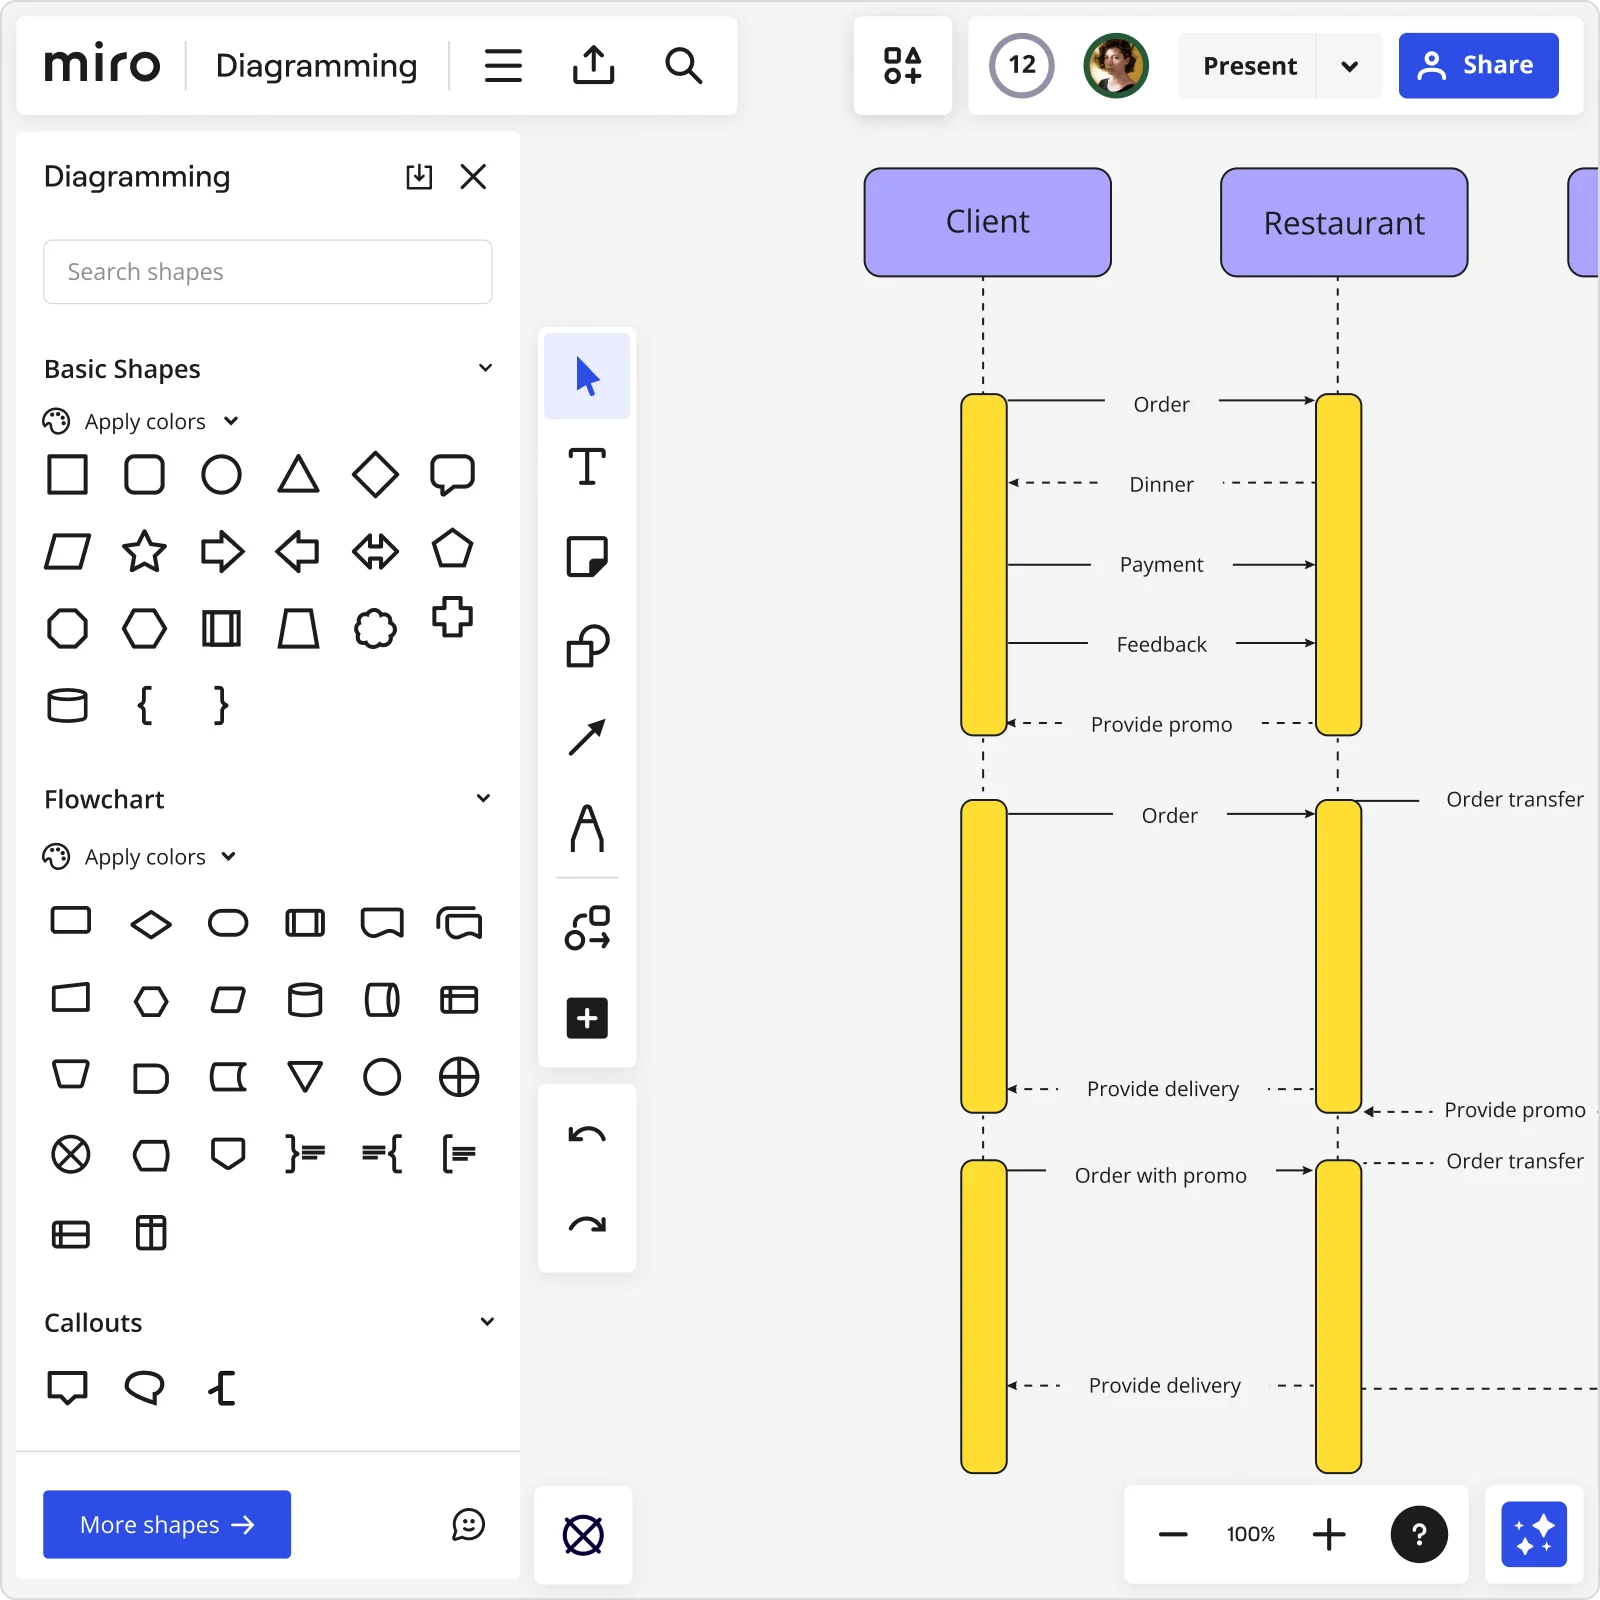
Save time, generate diagrams with AI
Get right into ideating and solving things with a prompt and click. Miro Assist can generate things like ERD, UML, and flowcharts in seconds.
Powerful tools and integrations for your entire team
Code-to-diagram. Advanced formatting. Layers. You get these options and a lot more with our draw.io, Mermaid, and PlantUML apps. All that power, and you never have to leave Miro.
Why the best development teams use Miro for diagramming
Powerful collaboration capabilities
Edit diagrams in real time with your team or record a Talktrack, an interactive video-voiceover, to easily explain complex systems or architecture diagrams.
Import & export your diagrams
Bring existing diagrams and process flows into Miro with just a few clicks. Import from Visio, drawio, or Lucidchart, or copy code from GitHub or Notion using our Mermaid and PlantUML apps.
Diagrams stay up to date
Live embed keeps your diagrams, like network topologies or database schemas, up to date on thousands of tools and websites such as Confluence, Coda, and Notion.
Build custom integrations to visualize your data
The Miro Developer Platform lets you create apps or integrations that automatically generate diagrams from company data and tools.
Related templates
Create a shared understanding of your Amazon Web Services architecture.
Visualize your Google Cloud Architecture deployment and optimize processes.
Map your Kubernetes Architecture applications.
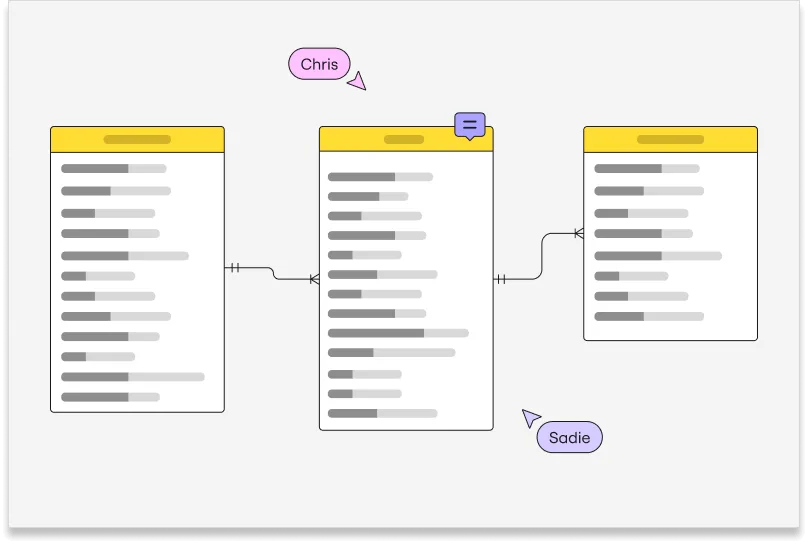
Model processes and map data flows.
Map how elements of your database interact with each other.
Easily model and design software by visually representing systems.
Visualize any kind of system
Unified Modeling Language
Get software to market faster — with less design reworks — by visually representing systems using UML.
Learn More
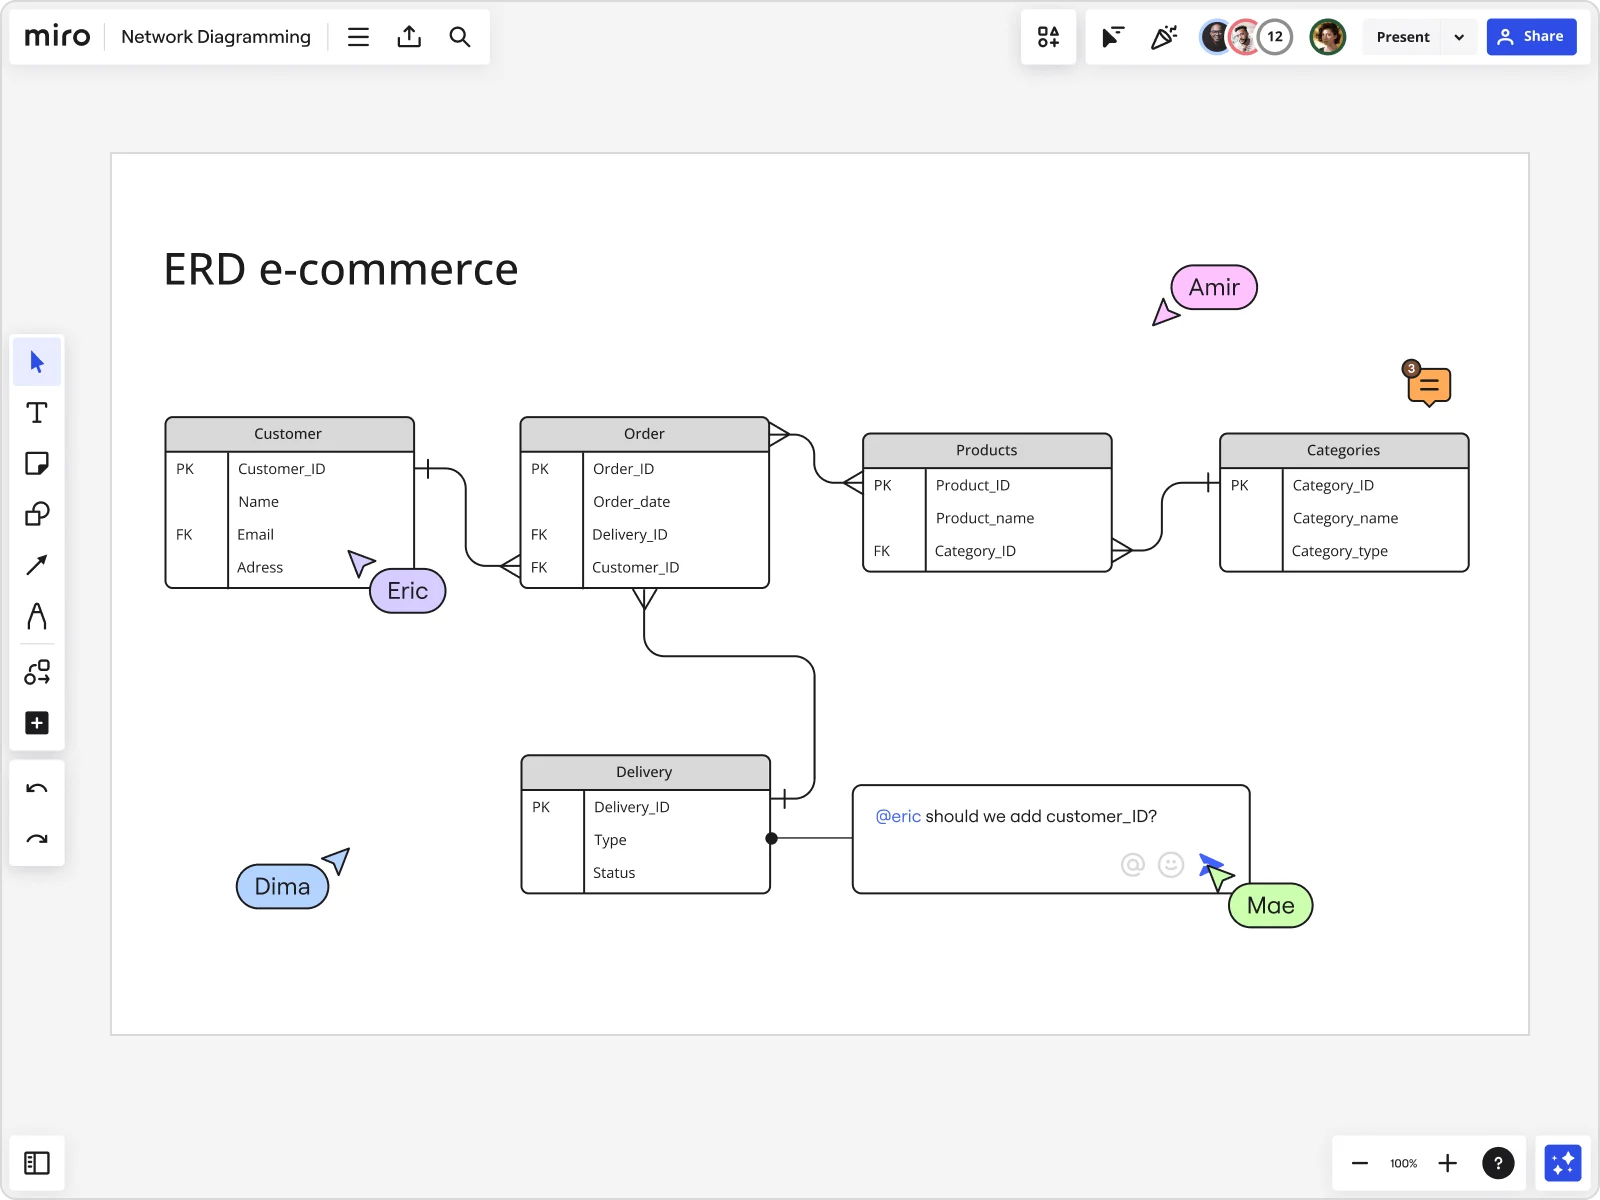
Entity Relationship
Create a visual representation of database structures, entities, and relationships to ensure all teams have a shared understanding.
Learn More
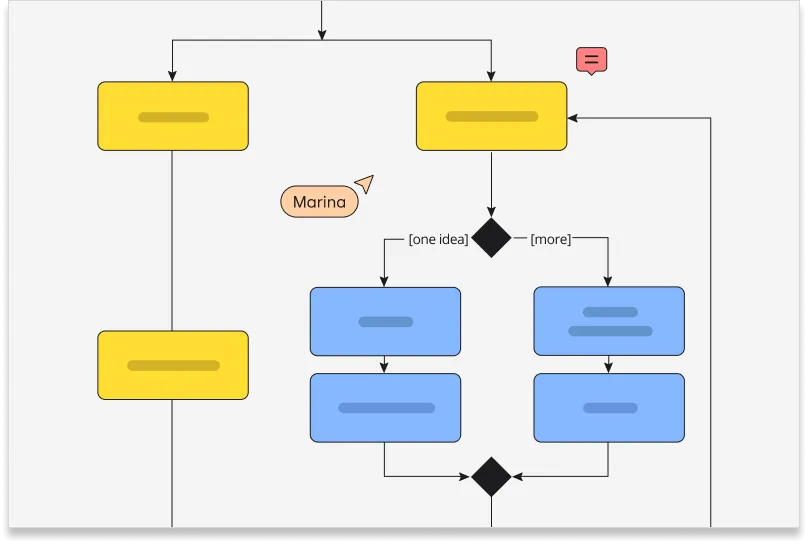
Data flow
Map data flows and model processes so you can streamline workflows, gain insights, and lead development teams more efficiently.
Learn More
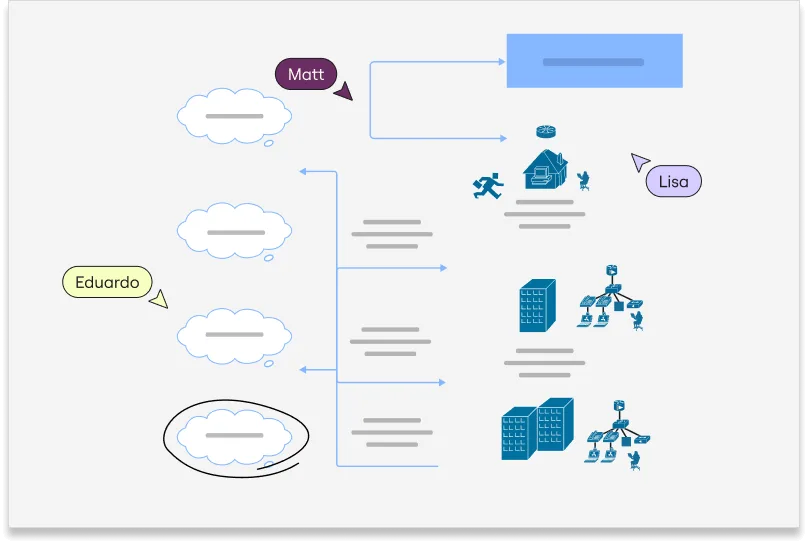
Network diagrams
Visualizing networks, such as cloud architectures, helps teams design current and future states, prepare for troubleshooting and maintenance, and enable effective change management processes.
Learn More
How to create a technical diagram in Miro
1
Gather the information
Whether it’s new insights from a brainstorm or workshop, or an existing technical document, you can bring everything onto one board.
2
Create your technical diagram
Start from scratch, use one of our templates, import diagrams from Lucidchart, Microsoft Visio, or Draw.io, copy existing code using Mermaid and PlantUML apps, or generate diagrams from text using Miro Assist.
3
Refine and review
Drop in comments or record a walkthrough of the diagram with Talktrack so people can review it on their own time, with all relevant context on the board.
4
Present and make things happen
Use Interactive Presentation Mode to present to your team, add code snippets using Code Block, embed the diagram into your projects on Confluence, and define next steps using task trackers like Jira cards.
Technical diagramming FAQ
In Miro you can make many technical diagrams using industry-standard shape packs including UML, ERD, dataflow, flowcharts. On the Help Center you can find the full list of shape packs.
Miro’s technical diagramming tool is designed for software engineers, system architects, network engineers, database administrators, business analysts, and DevOps engineers. Its user-friendly interface makes diagramming easy for anyone, with powerful features for expert-level work.
Nope! In Miro, everything happens in one space from brainstorming to diagramming and sharing. That way you have all the information in one space and everyone always has the context they need.
Yes! You can import .vsdx file formats into Miro from Lucidchart, Microsoft Visio and Draw.io. With your diagrams in Miro, you and your whole team can review, take action and collaborate in one workspace that everyone can access.
There are several ways. You can share the board with people in your team — even guests and visitors — you can embed your diagrams into tools like Confluence, and you can export as a PDF.
Read more
Read guide
Read guide
Read blog
Learn more
Get on board in seconds
Join thousands of teams using Miro to do their best work yet.