WorryFree Computers   »   [go: up one dir, main page]

Earlier this year, we announced additions to Google+ metrics to better understand user activity and community-level metrics. We’re continuing this effort to manage Google+ communities by introducing Google+ community metrics, surfaced in two places: the Admin console and in the Google+ community dashboard.

Metrics for community owners and moderators

First, community owners and moderators can now see new membership and engagement statistics about their community using the new "Insights" tab. If they’d like more information on a particular metric, mousing over it will provide additional context to help with interpreting the data.


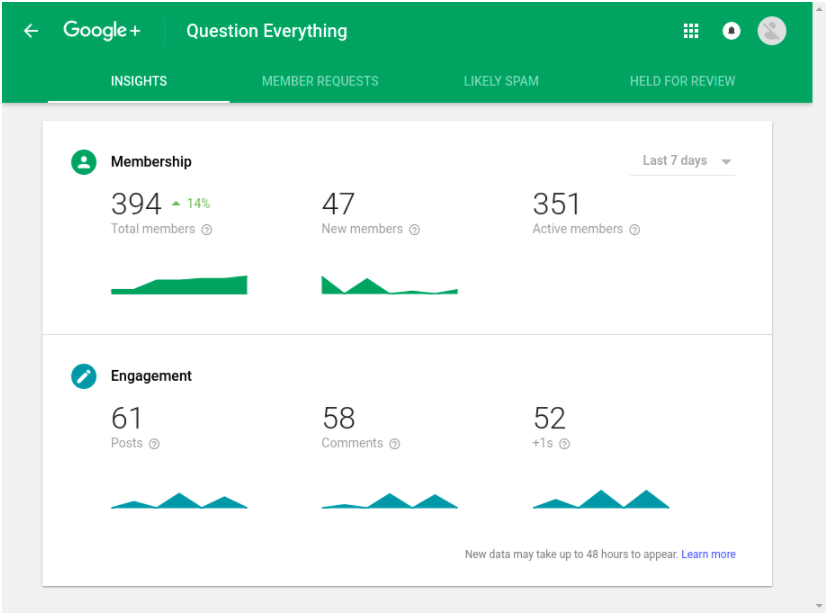
To access these insights, an owner or moderator can click on the “Manage” button (previously the “Moderate” button) and select the “Insights” tab.

Please note, this dashboard will only be available to owners and moderators of Google+ communities. For more information on moderating a Google+ community, please visit the Help Center.

Communities Report for admins

For G Suite administrators, we've also added the ability to see all communities owned by members of your organization, sortable by metrics such as total members, active members, number of posts recently made, and more. In this report, which can be found in the Admin console by going to Reports > Apps > Google+ > Communities report, you’ll also be able to see the community’s “Visibility,” indicating whether or not it’s restricted to your domain.


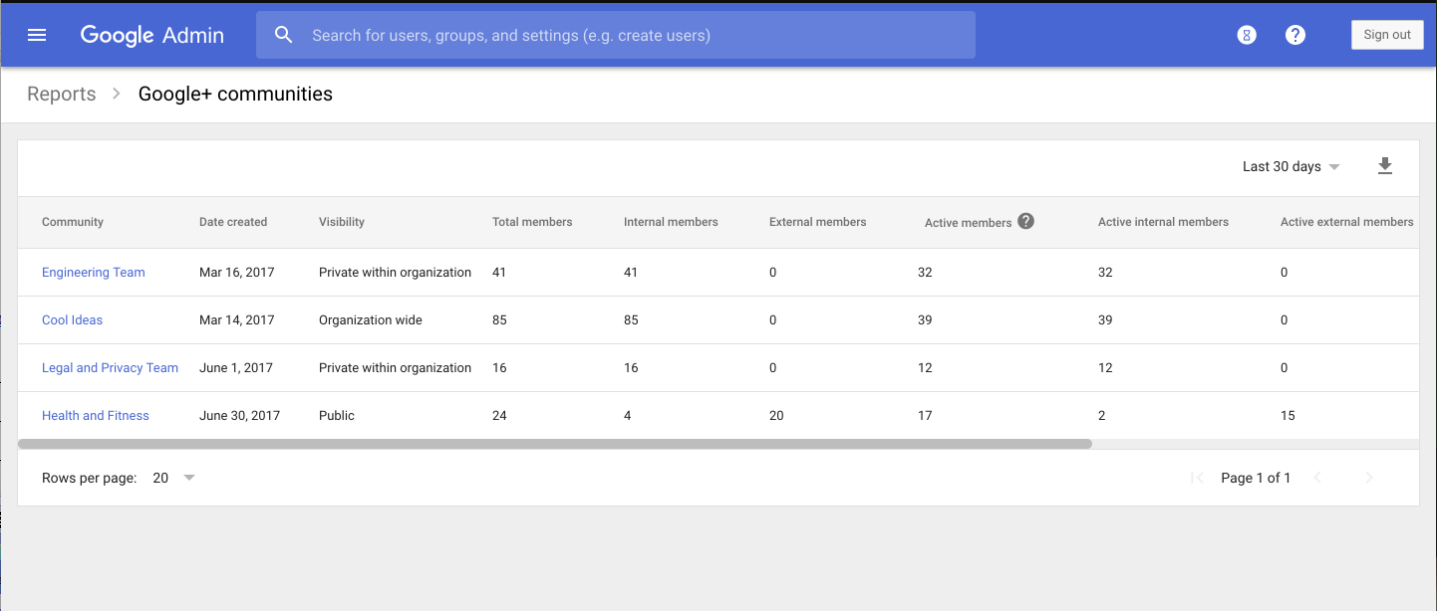
You can choose to view either the last seven or 30 days worth of data.

As with our previous reporting additions, these metrics are available in both the Admin console and Reports API.

Launch Details
Release track:
Launching to both Rapid Release and Scheduled Release

Editions:
Available to all G Suite editions

Rollout pace:
Full rollout (1–3 days for feature visibility)

Impact:
All end users (Community insights metrics)
Admins only (Communities admin report)

Action:
Change management suggested/FYI

More Information
Help Center: Moderate a community
Help Center: Google+ community metrics

Launch release calendar
Launch detail categories
Get these product update alerts by email
Subscribe to the RSS feed of these updates

Earlier this year, we launched Drive File Stream and Backup and Sync to help users in your organization more easily access files on their desktop computers. Many of you asked for a way to keep track of the changes to those two products. In response to your feedback, we’re now publishing regular release notes for both Drive File Stream and Backup and Sync on the Help Center. These release notes should help you stay on top of the additions and improvements made to each new version of the two products. We’ll continue to announce major changes on the G Suite Updates Blog as well.


Launch release calendar
Launch detail categories
Get these product update alerts by email
Subscribe to the RSS feed of these updates

In July 2017, we announced the release of the new version of the Calendar Interop tool, which allows for better coexistence between G Suite and Microsoft Exchange, including Office 365, environments. 

This new version of Calendar Interop provides the following benefits:

  • Real-time availability lookups between G Suite and Microsoft Exchange and Office 365 within the same organization on both mobile and web.
  • A new interoperability troubleshooting tool that allows administrators to understand the status of the setup with one click.
  • Use Google Calendar Find A Time on the web, Android, and iOS to find the best meeting time for all attendees.
  • Interoperability-related logs in the reporting section in Admin console so that admins can track interoperability-related successes and failures for each user.
As we continue to provide more features for the new Calendar Interop tool, we will be shutting down the classic version of Calendar Interop on February 28, 2018. Organizations that have previously configured the classic version of the Calendar Interop tool must switch to the new version of Calendar Interop by this date. If not, their existing Calendar Interop functionality will stop working and their users will not be able to look up availability information for any users within their Exchange deployment.

To make this switch easier, we have prepared the following detailed instructions in the Help Center: Move from the classic tool to new Calendar Interop.

With the transition to the new Calendar Interop tool, you and your users will experience a better coexistence across G Suite and Microsoft Exchange and Office 365 environments.

Launch Details
Impact:
All end users

Action:
Admin action suggested/FYI

More Information
Help Center: Move from the classic tool to new Calendar Interop
G Suite Updates: Improvements to Google Calendar Interop for Microsoft Exchange, with real time data, logging, and simpler setup

Launch release calendar
Launch detail categories
Get these product update alerts by email
Subscribe to the RSS feed of these updates

In June, we introduced a new resource for admins: What’s new in G Suite? Don’t forget to visit the page regularly for a list of the most recent launches across G Suite.

Feedback? Let us know.

(Cross-posted from The Keyword)

When it comes to data in spreadsheets, deciphering meaningful insights can be a challenge whether you’re a spreadsheet guru or data analytics pro. But thanks to advances in the cloud and artificial intelligence, you can instantly uncover insights and empower everyone in your organization—not just those with technical or analytics backgrounds—to make more informed decisions.

We launched "Explore" in Sheets to help you decipher your data easily using the power of machine intelligence, and since then we’ve added even more ways for you to intelligently visualize and share your company data. Today, we’re announcing additional features in Google Sheets to help businesses make better use of their data, from pivot tables and formula suggestions powered by machine intelligence, to even more flexible ways to help you analyze your data.

Easier pivot tables, faster insights

Many teams rely on pivot tables to summarize massive data sets and find useful patterns, but creating them manually can be tricky. Now, if you have data organized in a spreadsheet, Sheets can intelligently suggest a pivot table for you.*

In the Explore panel, you can also ask questions of your data using everyday language (via natural language processing) and have the answer returned as a pivot table. For example, type “what is the sum of revenue by salesperson?” or “how much revenue does each product category generate?” and Sheets can help you find the right pivot table analysis.**


In addition, if you want to create a pivot table from scratch, Sheets can suggest a number of relevant tables in the pivot table editor to help you summarize your data faster.

*You can view pivot tables on all platforms, but you can only create and edit them on the web.
**The “Answers” feature in Sheets is only available in English at this time.

Suggested formulas, quicker answers

We often use basic spreadsheet formulas like =SUM or =AVERAGE for data analysis, but it takes time to make sure all inputs are written correctly. Soon, you may notice suggestions pop up when you type “=” in a cell. Using machine intelligence, Sheets provides full formula suggestions to you based on contextual clues from your spreadsheet data. We designed this to help teams save time and get answers more intuitively.

Even more Sheets features

We’re also adding more features to make Sheets even better for data analysis:
  • Check out a refreshed UI for pivot tables in Sheets, and new, customizable headings for rows and columns.
  • View your data differently with new pivot table features. When you create a pivot table, you can “show values as a % of totals” to see summarized values as a fraction of grand totals. Once you have a table, you can right-click on a cell to “view details” or even combine pivot table groups to aggregate data the way you need it. We’re also adding new format options, like repeated row labels, to give you more fine-tuned control of how to present your summarized data.
  • Create and edit waterfall charts. Waterfall charts are good for visualizing sequential changes in data, like if you want to see the incremental breakdown of last year’s revenue month-by-month. Select Insert > Chart > Chart type picker and then choose “waterfall.”
  • Quickly import or paste fixed-width formatted data files. Sheets will automatically split up the data into columns for you without needing a delimiter such as commas between data.
These new Sheets features will roll out in the coming weeks—see specific rollout details below. To learn more about how G Suite can help your business uncover valuable insights and speed up efficiencies, visit the G Suite website. Or check out these tips to help get started with Sheets.

Launch Details
Release track: 
Launching to Rapid Release, with Scheduled Release coming on January 24th, 2018*

*Due to the holidays, the launch to Scheduled Release will occur more than the standard two weeks after the launch to Rapid Release. The rollout to Scheduled Release domains will begin on January 24th, 2018.

Editions:
Available to all G Suite editions

Rollout pace:
Extended rollout (potentially longer than 15 days for feature visibility)

Impact:
All end users

Action:
Change management suggested/FYI

More Information
Help Center: See and use suggested charts and analysis in a spreadsheet
Help Center: Create and use pivot tables
Help Center: Customize a pivot table
Help Center: GETPIVOTDATA
Help Center: Chart and graph types
Help Center: Import data sets and spreadsheets
Help Center Separate cell text into columns


Launch release calendar
Launch detail categories
Get these product update alerts by email
Subscribe to the RSS feed of these updates

We recently made it possible to embed webpages as iframes in the new Google Sites. With this launch, we’re giving you one more tool to customize your sites—you can now embed HTML and JavaScript code directly into your sites.


To get started, select Embed from the Insert menu and choose Embed Code. For more details, visit the Help Center.

Launch Details
Release track:
Launching to Rapid Release, with Scheduled Release coming on January 2nd

Editions:
Available to all G Suite editions

Rollout pace:
Gradual rollout (up to 15 days for feature visibility)

Impact:
All end users

Action:
Change management suggested/FYI

More Information
Help Center: Add text, images & other content


Launch release calendar
Launch detail categories
Get these product update alerts by email
Subscribe to the RSS feed of these updates

Update (April 5, 2018):

The Google Photos tab has now been removed from the left-hand navigation in Drive. Please see the blog post below for more information.


Today in Google Drive you can view your Google Photos directly via a tab in the left navigation and from folders within My Drive.


In early January 2018, we will simplify Drive navigation by removing the Google Photos tab. You can continue to access your photos and videos in Drive by creating a Google Photos folder in My Drive. Learn more in the Help Center.


You can still access your photos and videos in Google Photos on the web, Android, and iOS.

Launch Details
Release track:
Launching to both Rapid Release and Scheduled Release in early March 2018.
Please monitor the G Suite release calendar for a specific launch date.

Editions:
Available to all G Suite editions

Rollout pace:
Full rollout (1–3 days for feature visibility)

Impact:
All end users

Action:
Change management suggested/FYI

More information
Help Center: How Google Photos works with Google Drive

Launch release calendar
Launch detail categories
Get these product update alerts by email
Subscribe to the RSS feed of these updates

We’re making two changes in the Admin console to improve the visibility of reports for specific G Suite apps.

First, we’re renaming “Aggregate reports” to “Apps.”

Second, we’re moving all of the app-specific reports previously nested under Reports > Aggregate reports to the left-side navigation. These will appear beneath an expandable arrow and be organized in three subsections under Reports: “Apps,” “Devices,” and “Users.” All of the previous user-level reports will now be nested under the “Users” subsection of reports. This change will allow you to jump right into these reports from the main reports page in the Admin console and bring a clear categorization to individual reports.

Both of these changes can be found by navigating to Reports > Apps in the Admin console.

Old reports navigation:


New reports navigation:


Launch Details
Release track:
Launching to both Rapid Release and Scheduled Release

Editions:
Available to all G Suite editions

Rollout pace:
Full rollout (1–3 days for feature visibility)

Impact:
Admins only

Action:
Admin action suggested/FYI

More Information
Help Center: Monitor usage and security with reports

Launch release calendar
Launch detail categories
Get these product update alerts by email
Subscribe to the RSS feed of these updates

With Single-Sign-On (SSO), users can access all of their enterprise cloud applications—including the Admin console for admins—after signing in just one time. Google supports the two most popular enterprise SSO standards, OpenID Connect and SAML, and there are more than 800 applications with pre-integrated SSO support in our third-party apps catalog already.

We’re now adding SAML integration for 9 additional applications: Dashlane, Docebo, Front, InVision, IT Glue, Pivotal Tracker, Sumo Logic, SurveyMonkey and Zoom. 

You can find our full list of pre-integrated applications, as well as instructions for installing them, in the Help Center.

Note that apart from the pre-integrated SAML applications, G Suite also supports installing “Custom SAML Applications,” which means that admins can install any third-party application that supports SAML. The advantage of a pre-integrated app is that the installation is much easier. You can learn more about installing Custom SAML Applications in this Help Center article.

Launch Details
Release track:
Launching to both Rapid release and Scheduled release

Editions:
Available to all G Suite editions

Rollout pace:
Gradual rollout (potentially longer than 3 days for feature visibility)

Impact:
Admins only

Action:
Admin action suggested/FYI

More Information
Help Center: Using SAML to set up federated SSO

Launch release calendar
Launch detail categories
Get these product update alerts by email
Subscribe to the RSS feed of these updates